Report by Paula Antolini, June 16, 2020, 2:13PM EDT

on the Bethel High School football field in 2015.
(File photo ©2015 BETHEL ADVOCATE /Paula Antolini)
Readers want to know: How many minority individuals are on staff in the Bethel Public Schools System and what are the hiring policies?
We also added the student count according to Race/Ethnicity, for your information.
On June 5, 2020, we asked Dr. Christine Carver, Superintendent of Bethel Public Schools (BPS), about the numbers of minority individuals hired on staff at Bethel Public Schools, and other details regarding the employees and school policies regarding hiring practices.
Dr. Carver replied by sending us Policy number 4111.3 (view our report HERE) but it was still not the entire answer we were looking for, about present number of minority individuals hired on staff in Bethel Public Schools.
In order to obtain the information we requested, because we were not getting any further answers, we had to submit an FOIA (Freedom of Information Act) request to Dr. Carver on June 9, 2020. We asked:
1) Please supply a list of names, racial ethnicity, job titles and salaries, including the number of exactly how many minority individuals are employed by at Bethel Public Schools/Town of Bethel.
2) Also supply a list of individuals with same info. as above, that are on the Board of Education or any other boards or committees related to the Bethel education system.
Dr. Carver finally replied:
“In response to your request, we can provide you with a list of all employees, job titles, and salaries. We can not provide you with each individual’s racial ethnicity. As is consistent with the U.S. Equal Opportunity Commission, we do not request that applicants submit race and thereby do not collect the data. As stated by the EOC, collection of that data can cause discriminatory hiring practices and we do not request it from our applicants or employees. We do not collect the racial or ethnicity data on the Board of Education, or any committees related to the Bethel Public Schools.
buy Diflucan online Buy Diflucan no prescription cheap Diflucan generic
However, Carver did direct us to a state website that “tracks the race of all certified staff through the application process for certification” by district, she said, “We use that information to look at the counts and percentages of staff by racial categories.”
So obviously the minority numbers are right there in the report but she would not send them to us herself, however, individual names/race are not recorded it seems.
We have yet to receive the employees names, job titles, and salaries we requested. We messaged her again today and received an automatic reply that she is out of the office until June 26, 2020. However, we received this additional response today from Dr. Carver: “Laila Rudinas is the aware of the original request and is working on it. As my letter indicated, we will get you the information as soon as possible.” This is from a request two weeks ago.
*****
HERE IS THE FINAL INFORMATION we were able to obtain only by searching through a link provided in Carver’s official response to the FOIA request:
Connecticut State Department of Education
buy Doxycycline online Buy Doxycycline no prescription cheap Doxycycline generic
District Profile and Performance Report for School Year 2018-19
Bethel School District (latest available)
*****
DISTRICT OF BETHEL / STAFF INFO:
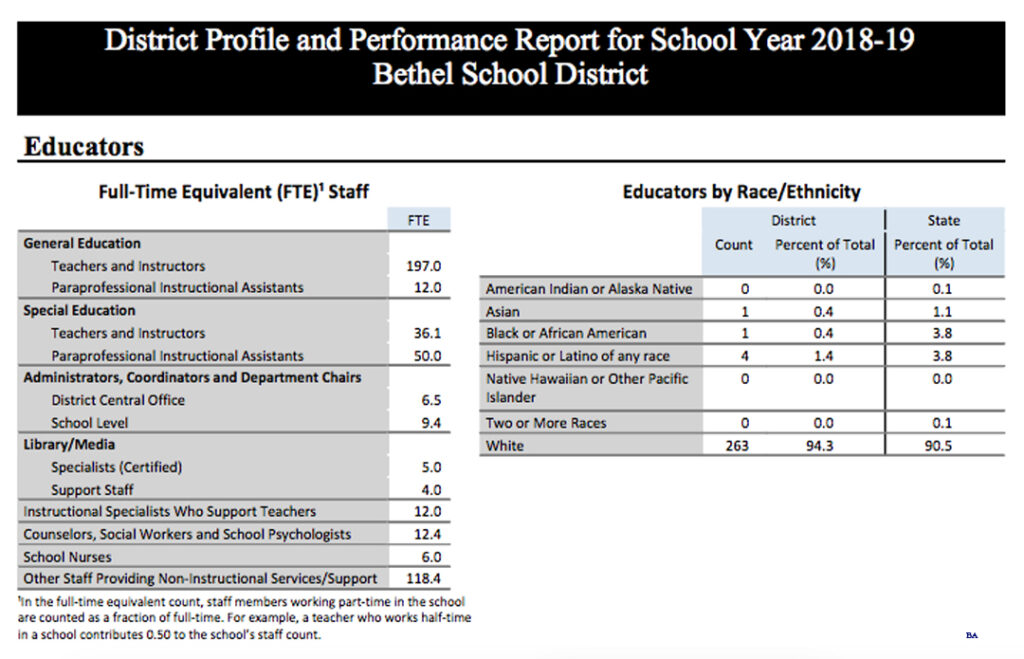
Educators in Bethel by Race/Ethnicity are: 263 (94.% of district total) White; 4 (1.4% of district total) Hispanic, Latino of any race; 1 (0.4% of district total) Black or African American; 1 (0.4% of district total) Asian; 0 Two or more races; 0 American Indian or Alaska Native; 0 Native Hawaiian or Other Pacific Islander.
Educators in Bethel, Full-time Equivalent (FTE)* Staff are 197 General Education Teachers and Instructors; 12 General Education Paraprofessional Instructional Assistants; 36.1 Special Education Teachers and Instructors; 50 Special Education Paraprofessional Instructional Assistants; 6.3 Administrators, Coordinators and Department Chairs, District CentralOffice; 4 Administrators, Coordinators and Department Chairs, School Level; 5 Library/Media Specialists (Cerified); 4 Library/Media Support Staff; 12 Instructional Specialists Who Support Teachers; 12.4 Counselors, Social Workers and School Psychologists; 6 SchoolNurses; 118.4 Other Staff Providing Non-Instructional Services/Support. (*In the full-time equivalent account, staff members working part-tie in the school are counted as a fraction of full-time. For example, a teacher who works half-time in a school contributes 0.50 to the school’s staff count.)
View these and other figures in the chart below:

*****
DISTRICT OF BETHEL / STUDENT INFO:
Out of 3,112 total students in grades PK-12 for the October 1, 2018 Enrollment², there are 1,456 female students, 1,656 male students.
Race/Ethnicity is: White 2,080 students (66.8% of district total); Hispanic or latino of any race 609 students (19.6% of district total); Asian 208 students (6.7% of district total); Black or African American 99 students (3.2% of district total); Two or more races 93 students, American Indian or Alaska Native (*) students, Native Hawaiian or Other Pacific Islander (*) students. (Note: To protect student privacy, gender counts are suppressed (*) when fewer than 6 students enrolled in the district identify as non-binary.) See more categories on chart below.
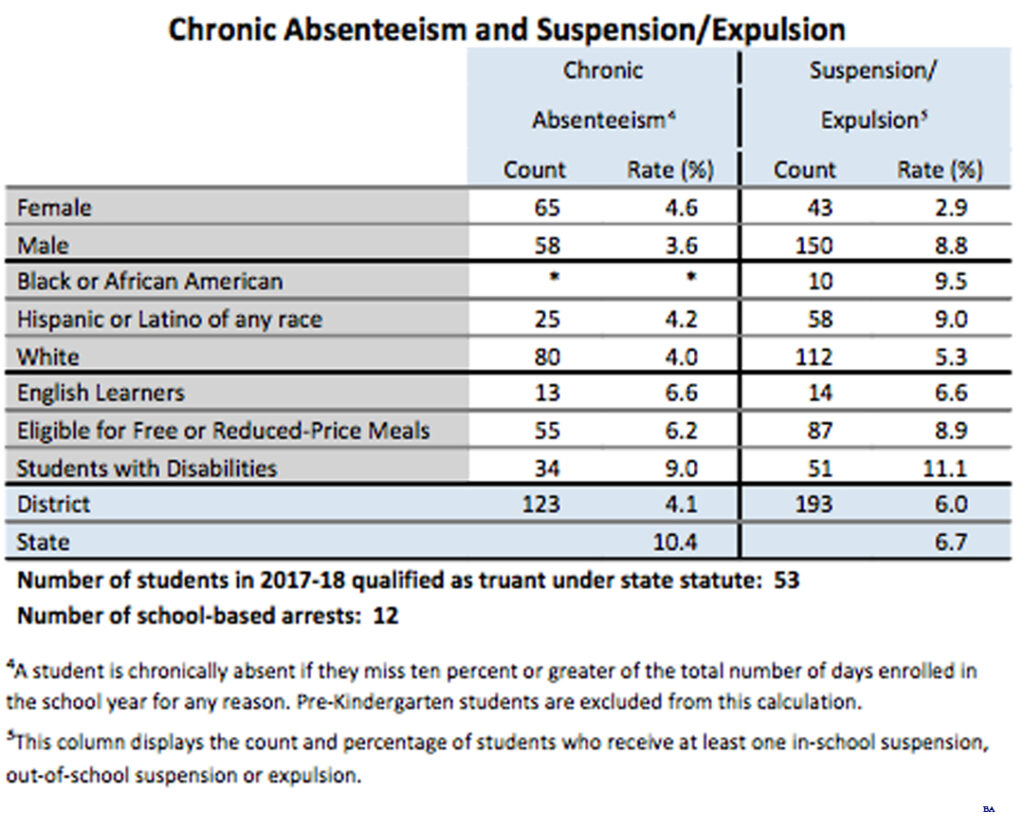
Chronic Absenteeism includes: Female 65 students (4.6%), Male 58 students (3.6%). White 80 students (4.0%), Hispanic or latino of any race 25 students (4.2%), Black or African American (*) students, Two or more races 93 students (3.0% of district total); American Indian or Alaska Native (*) students, Native Hawaiian or Other Pacific Islander (*) students. See more categories on chart below.
Truancy and Arrests includes “Number of students in 2017-2018 qualified as truant under state statute: 53 students. Number of school-based arrests: 12 students.”
View charts below:


*****
Connecticut Education at a Glance:
Overview: There are 206 districts, 1,514 Public Schools/Programs, 527,829 Total Student Enrollment, 10.4% Chronic Absenteeism Rate. Educators: 52,005.3 Certified Staff FTE, 9.6% Minority Certified Staff. Performance: 74.2 State Accountability Index*, 88.5% Four-year Cohort Graduation Rate*, *Metric from Next Generation Accountability
| OVERVIEW 206 Districts 1,514 Public Schools/Programs | STUDENTS 527,829 Total Enrollment 10.4% Chronic Absenteeism Rate* | EDUCATORS 52,005.3 Certified Staff FTE 9.6% Minority Certified Staff | PERFORMANCE 74.2 State Accountability Index* 88.5% Four-year Cohort Graduation Rate* |
*****
DEMOGRAPHICS OF BETHEL, CONNECTICUT:
Demographics show a loss of residents, 19,526 in 2013-2017 to 17,618 in 2020, with a growth of -3.6% during 2013 to 2017.
Race/Ethnicity 2013-2017 is: White Non-Hispanic 16,365; Hispanic or Latino 1,378; Asian Non-Hispanic: 1,083; Black Non-Hispanic: 423; Other/Multi-Race Non-Hispanic: 272; Native American Non-Hispanic: 5.
See other figures on charts below.

EDITOR NOTE: We are still waiting for ANY information regarding minority on staff in the Town of Bethel government, we have not received an answer to our FOIA (Freedom of Information Act) questions sent two weeks ago.
###
